New charts released by the government show the rise and fall of daily coronavirus cases across Lincolnshire’s district councils.
The COVID-19 dashboard now includes breakdowns of how the virus has progressed, broken down up to local authority level. They include Pillar 1 and 2 data.
It comes as government hopes to identify new outbreaks and lock them down locally rather than nationally, as was the case in Leicester.
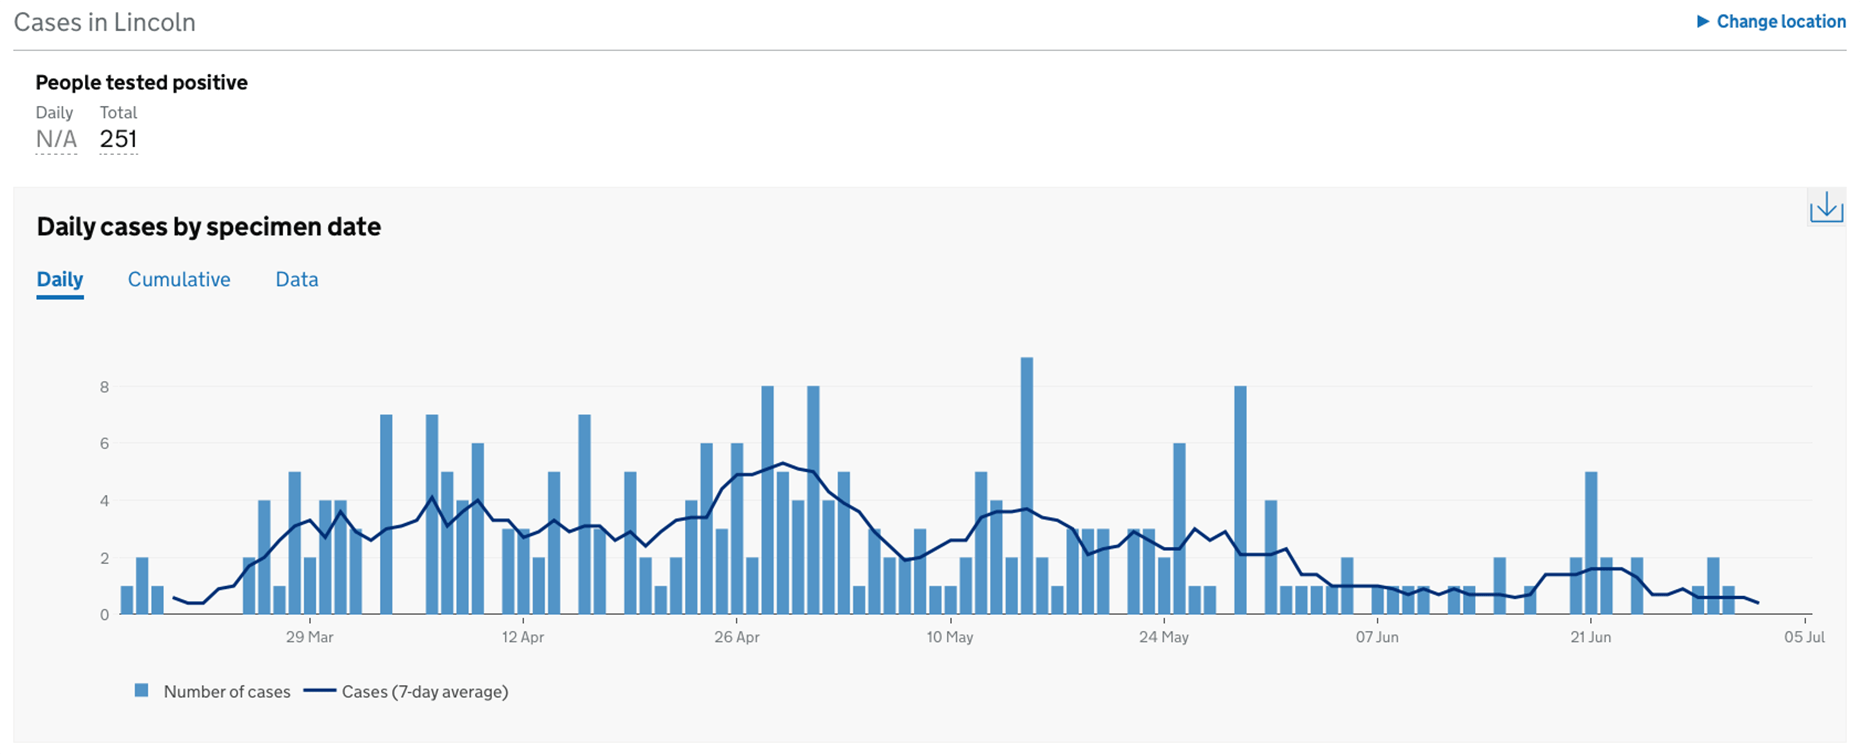
The information does not show Lincolnshire as a whole, however the county’s capital Lincoln shows a peak of nine cases confirmed on May 5.
Lincoln’s graph as of July 6.
The seven-day average for the city only once peaked above four, reaching 5.3 on one occasion.
As of July 5, the city had confirmed 251 cases overall.
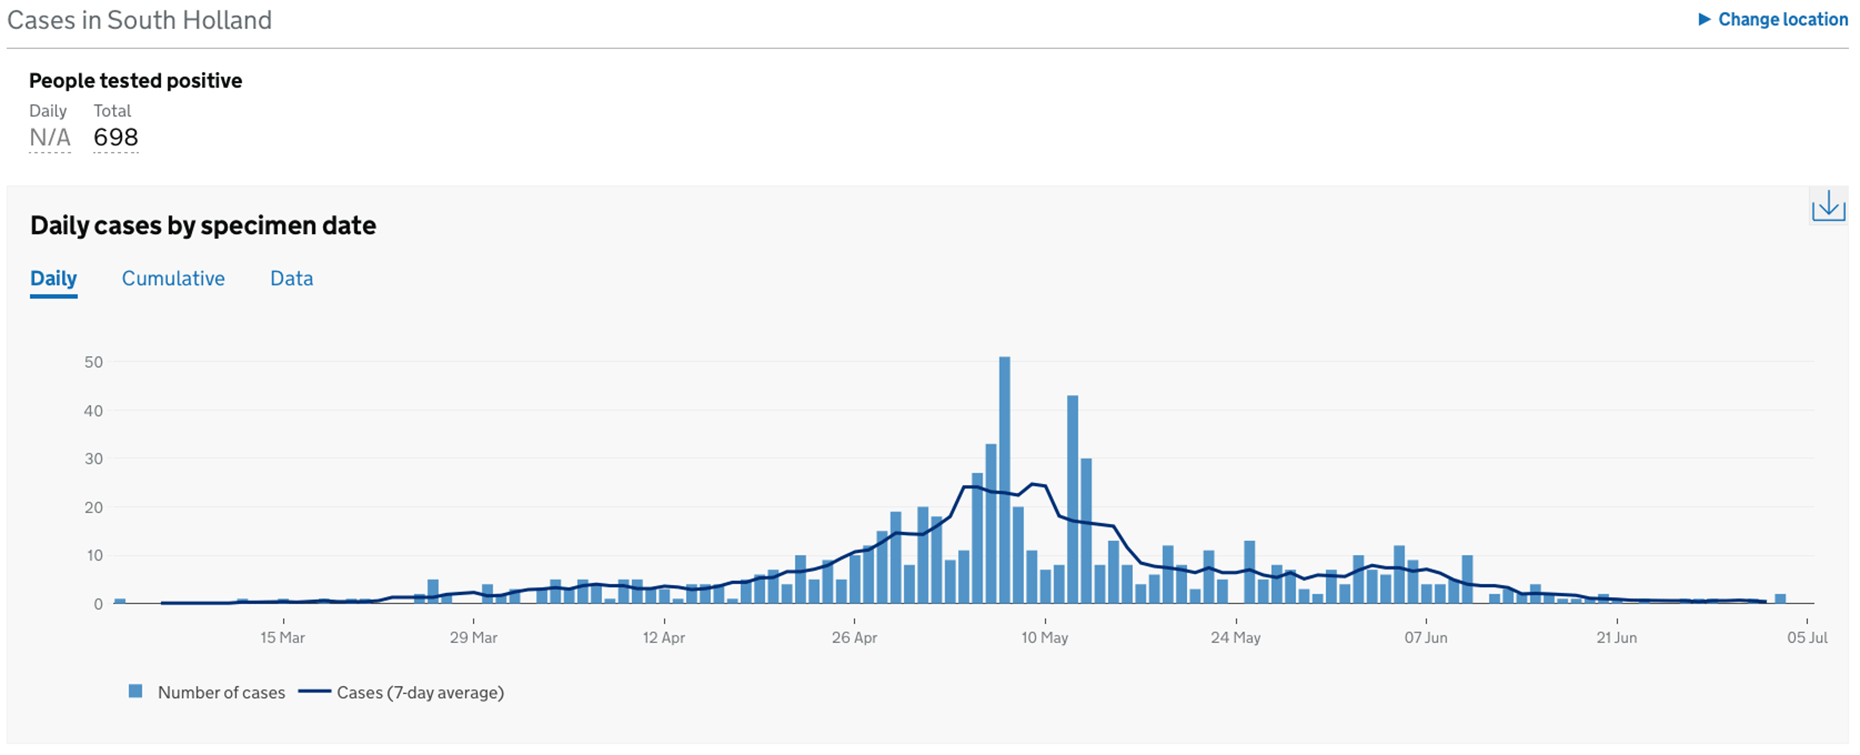
The area with the highest number of cases is South Holland with 698.
The district’s chart in this instance shows a gradual peak and downward trend, however, it peaked with 51 cases on May 7, with other days hitting 43 and 33 new cases. The highest seven-day average peaked to 24.7 on May 9.
South Holland’s graph as of July 6.
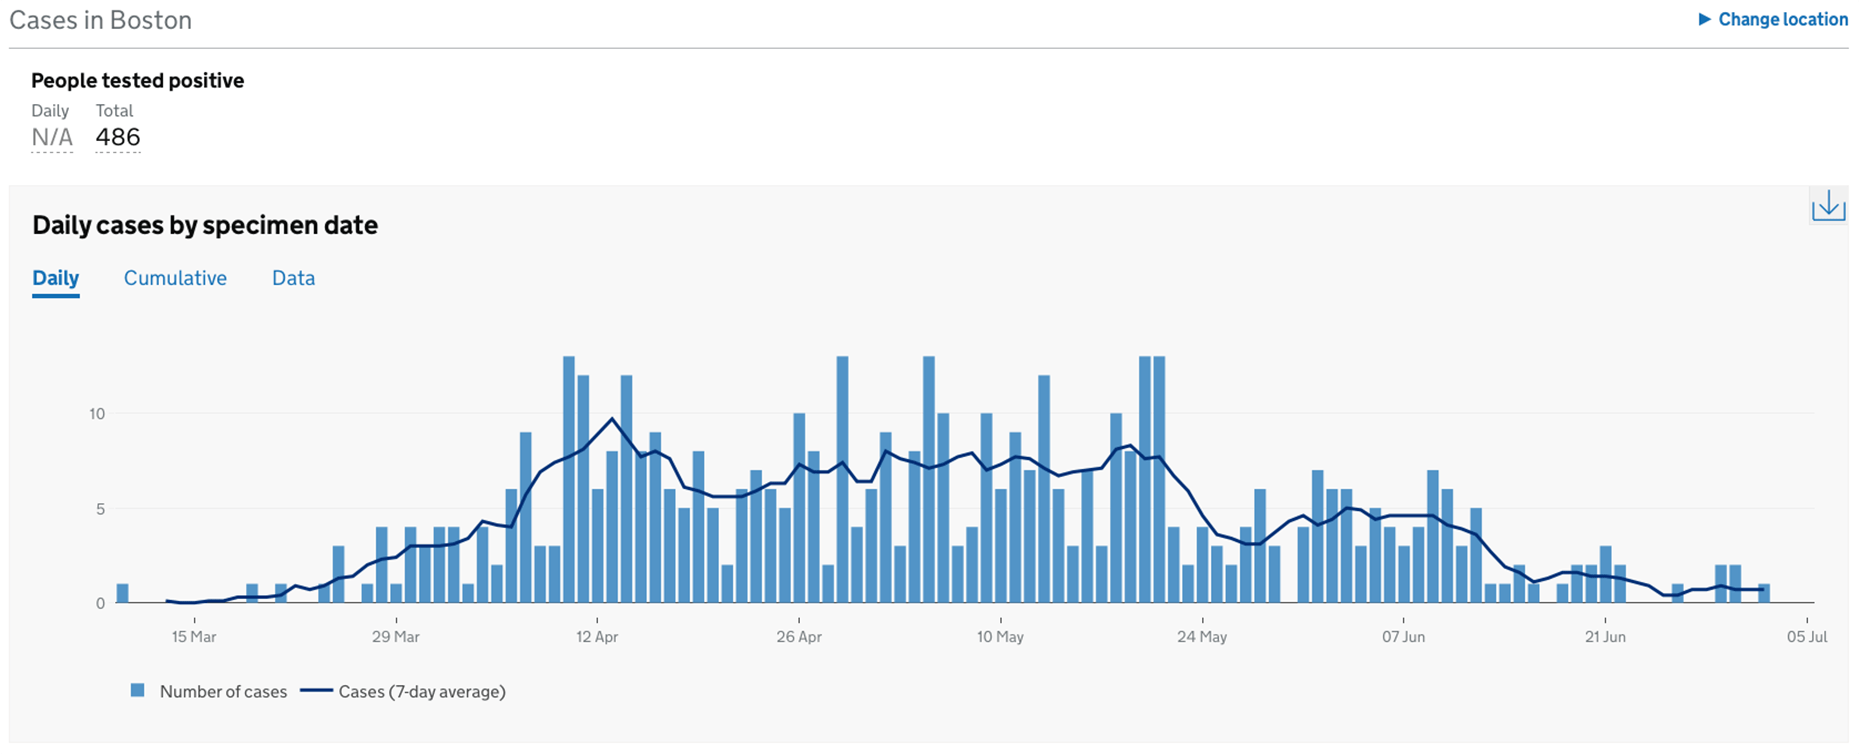
Here are the other district authorities’ highest peaks (and when they hit them):
Boston, 13 (April 12 & 29, May 5, 20 & 21)
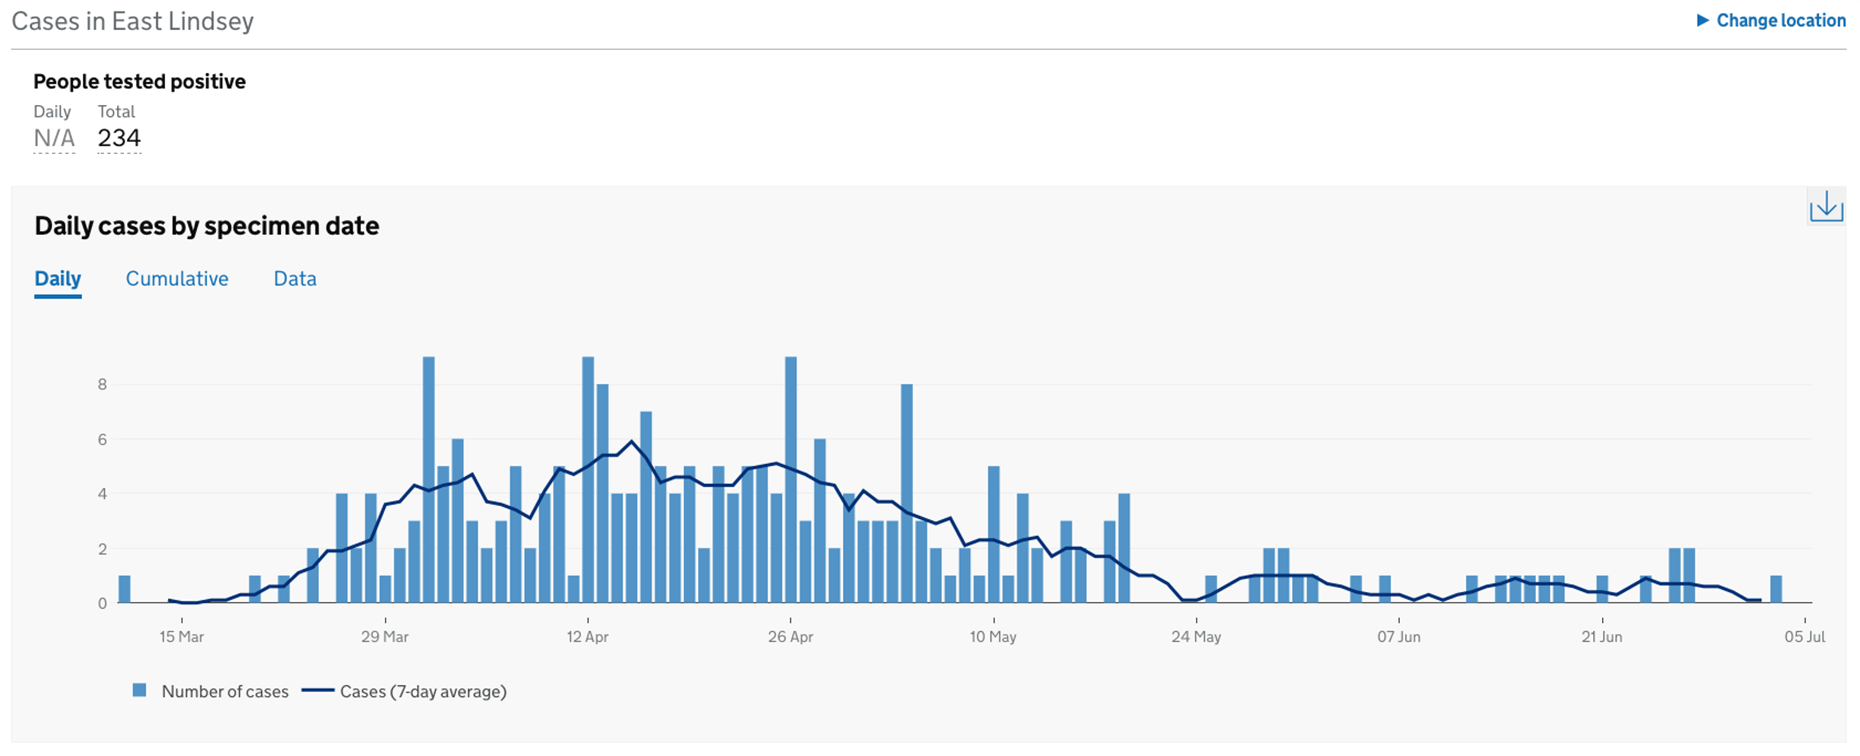
East Lindsey, 9 (April 1, 12 & 26)
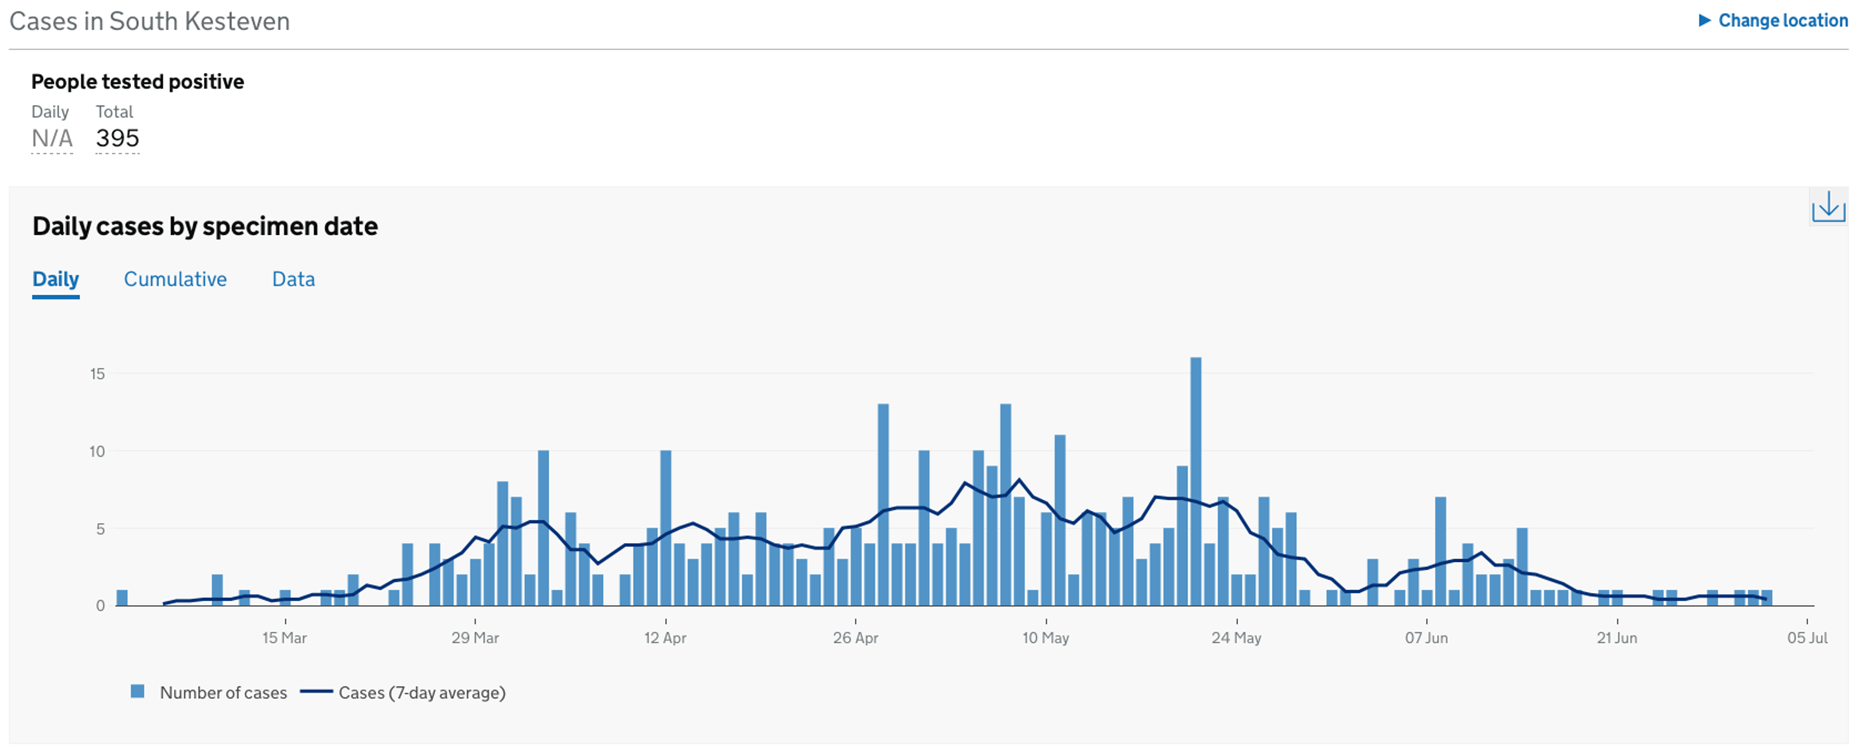
South Kesteven, 16 (May 21)
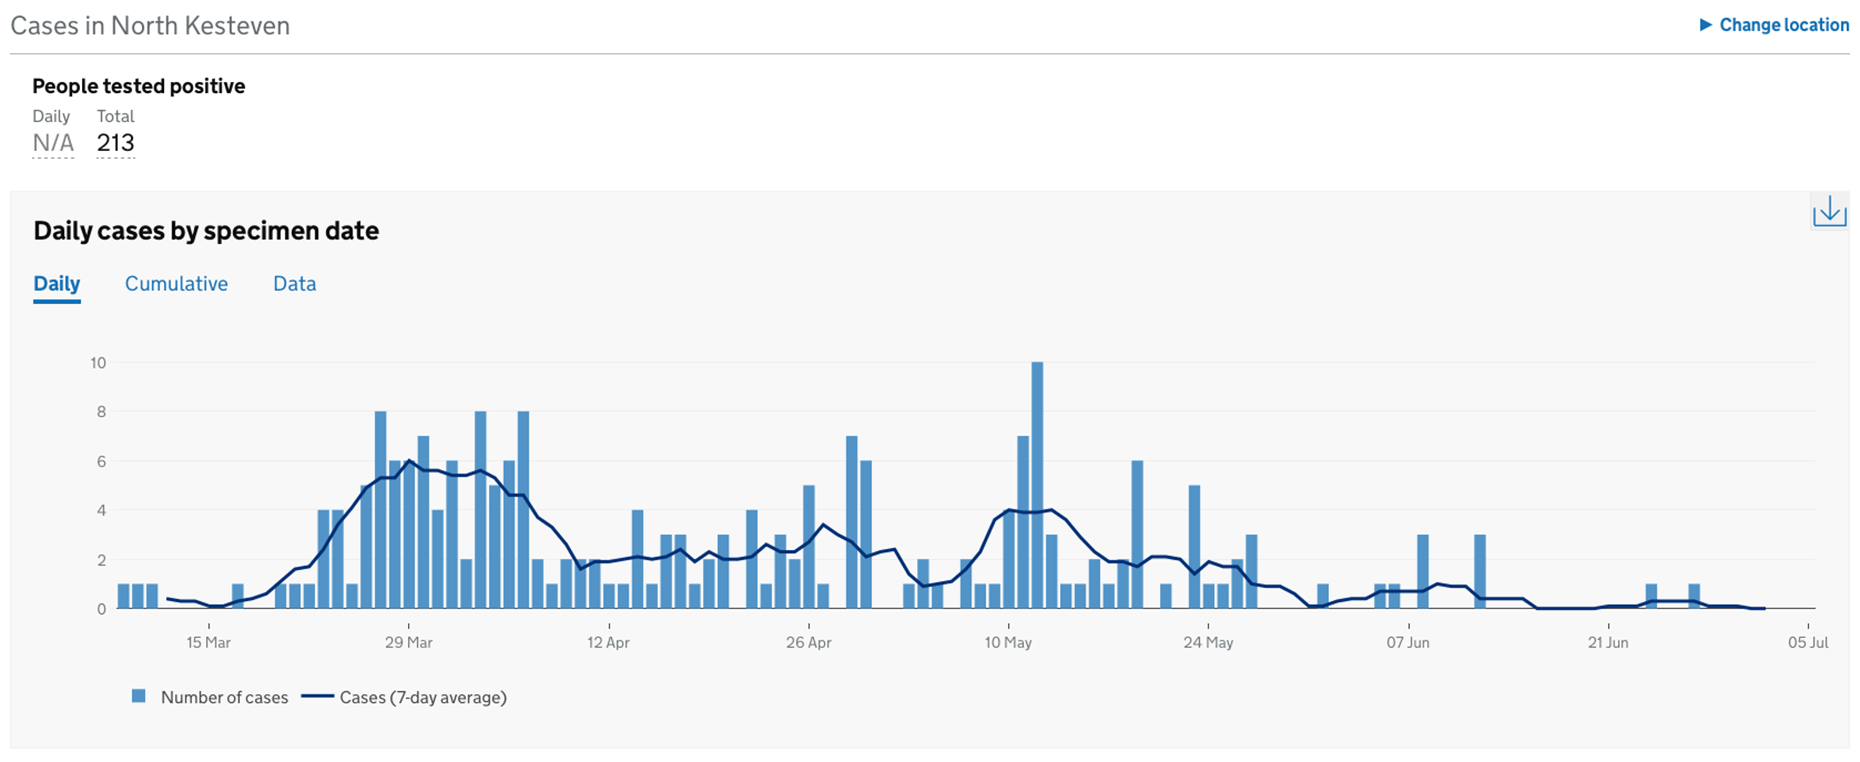
North Kesteven, 10 (May 12)
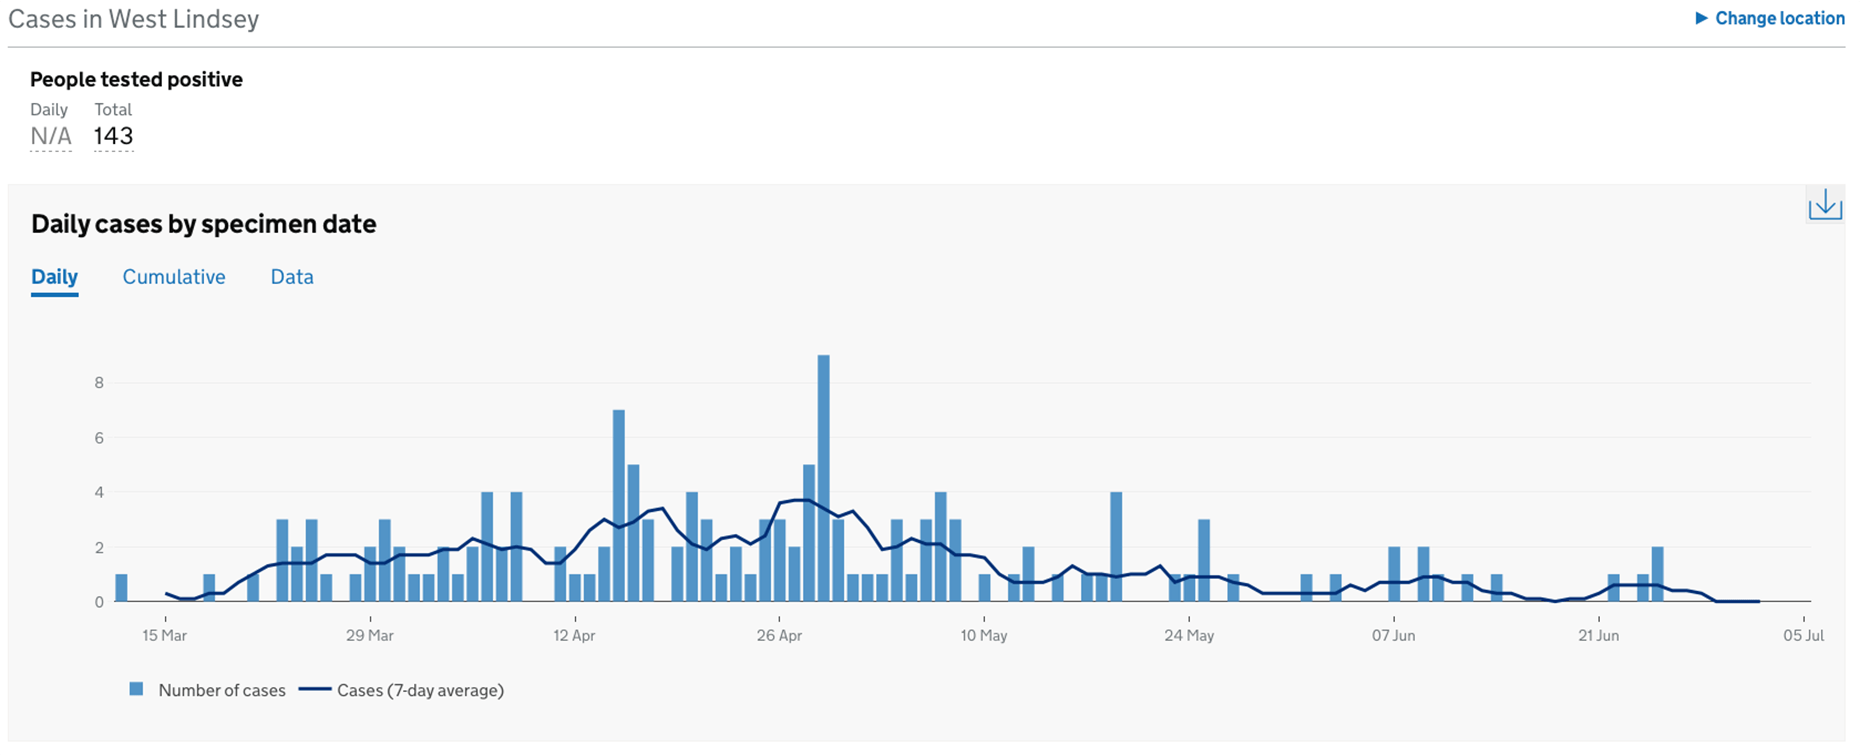
West Lindsey, 9 (April 29)
Below are all the district charts:
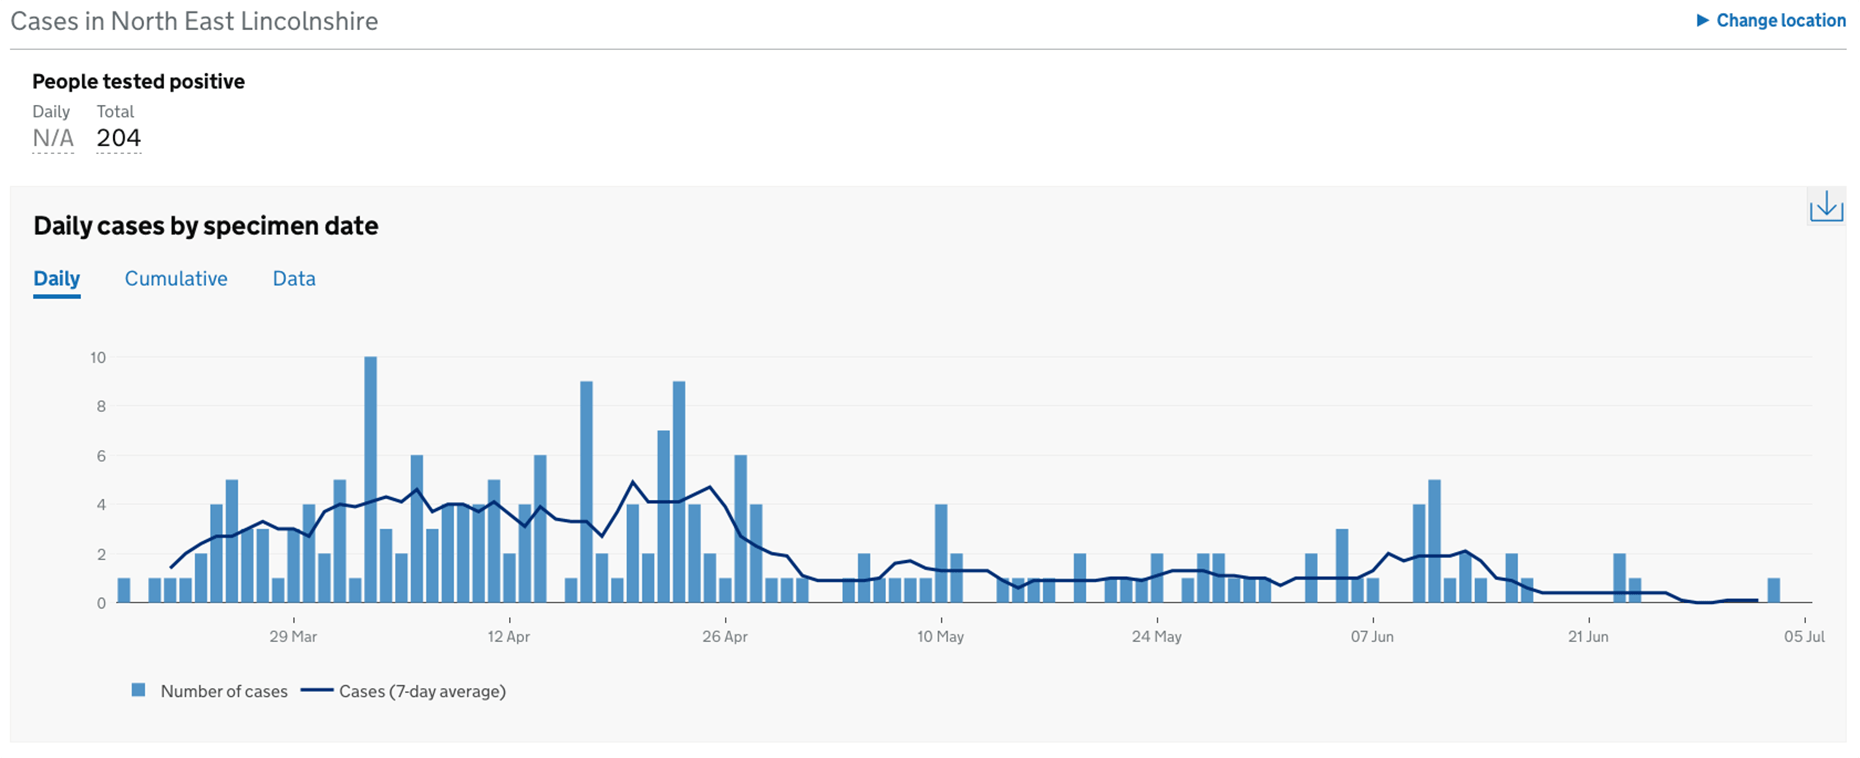
North East Lincolnshire has seen the fewest confirmed cases out of the three Greater Lincolnshire authorities with North Lincolnshire and Lincolnshire County Council.
Out of its 204 cases, the highest peak was on April 3 when 10 cases were confirmed. Its seven-day rolling average peaked on April 20, with 4.9 cases.
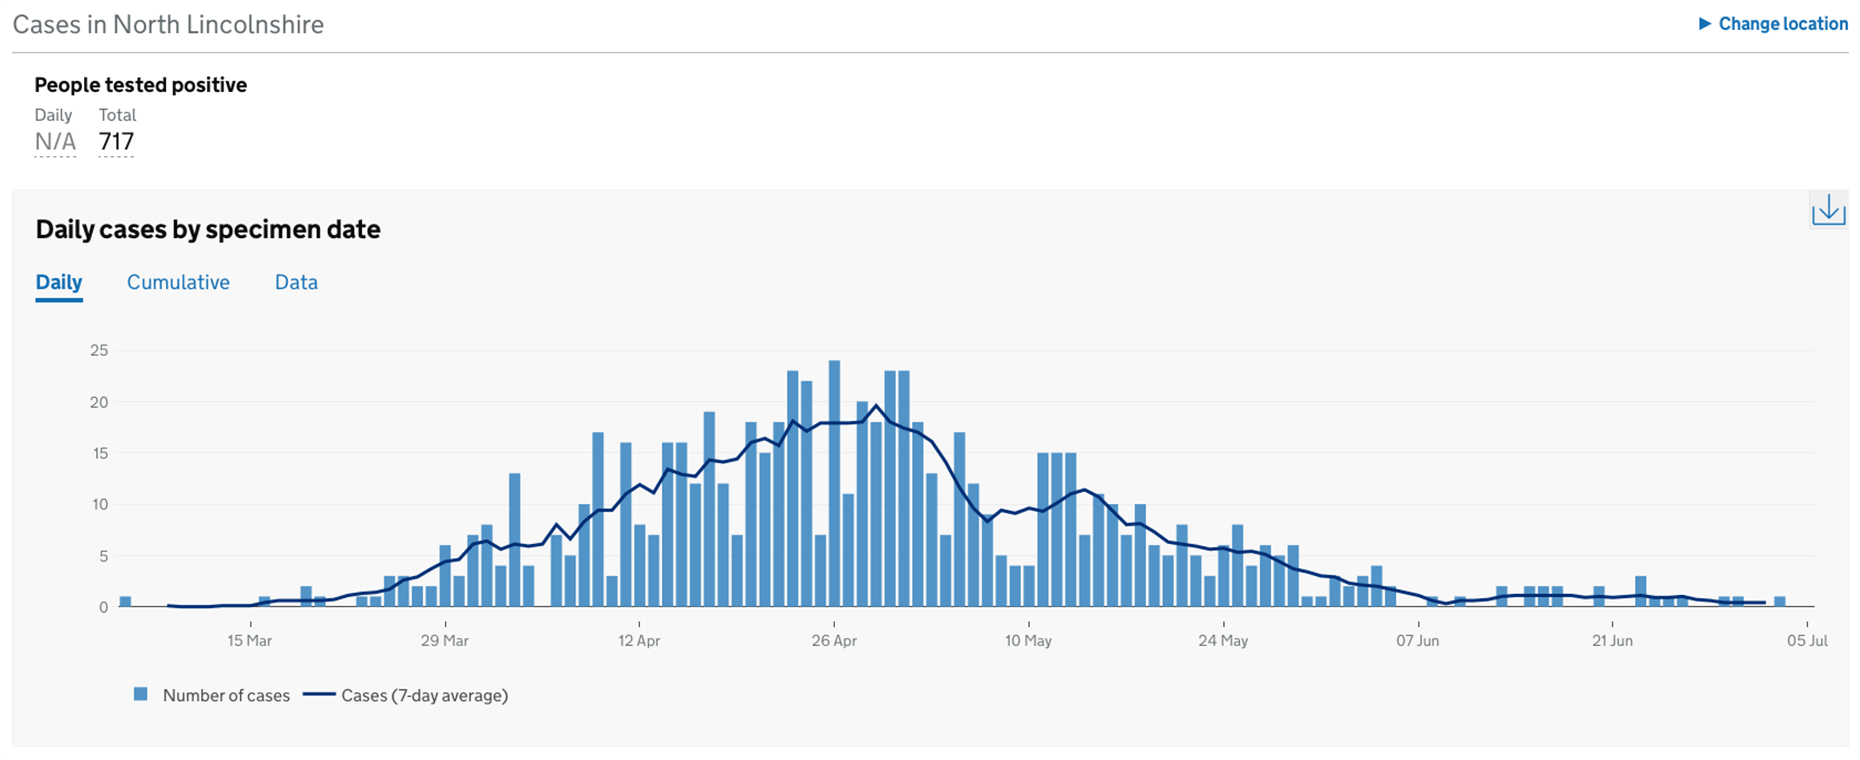
Meanwhile, North Lincolnshire saw a maximum of 24 cases on April 26, with its seven-day average hitting 19.6 a few days later on April 29.
The authority has confirmed 717 cases in total so far.
The dashboard, however, only breaks down the number of cases into local authorities, but does not yet show the number of deaths or testing in the area.
The Lincolnite welcomes your views. All comments are reactively-moderated and must obey the house rules. Please stay on topic and be respectful of other readers.
Exciting news for MyLocal app users and The Lincolnite readers! Our latest update is now available to download from your app store and comes packed with the best local news experience you can enjoy.
Revamped News Feed: Enjoy faster loading times and smoother scrolling that make catching up on local news a breeze.
New Play Video Feed: Dive into a dynamic video feed that brings local stories to life in a whole new way.
Enhanced In-App Browser: Access external links quickly and efficiently, right from the app, without any distractions.
Update your MyLocal app from your app store (version 2.73) now and start enjoying these great new features today!
P.S.: Start your MyLocal membership today to support MyLocal and The Lincolnite deliver you a better local news experience and honest journalism from across Lincolnshire.
P.P.S.: We have some huge things in the pipeline, stay tuned!
 Whatsapp