As the last of the coronavirus restrictions look set to be lifted in the next few days there are concerns cases are already starting to rise.
All of Lincolnshire’s COVID-19 PCR testing sites, including the mobile units, will close later this month.
However, the chairman of the Health Scrutiny Committee at Lincolnshire County Council on Wednesday said he would “not be surprised” to see them reopen later this year, with potential new variants being discovered.
Councillor Carl Macey was responding to Grantham Councillor Ray Wootten who said he was concerned about cases spiking in his area.
“Trying to genome sequence any variants is incredibly difficult for public health and it’s something that I think we need to, certainly centrally, need to be keeping a very close watching eye on,” said Councillor Macey.
“I wouldn’t be at all surprised if come the end of the year if we’re looking at bringing the testing regime back in with a different variant that’s recently apparent at this moment in time.”
So how does the COVID situation look right now?
Cases begin to swing upwards in Lincolnshire
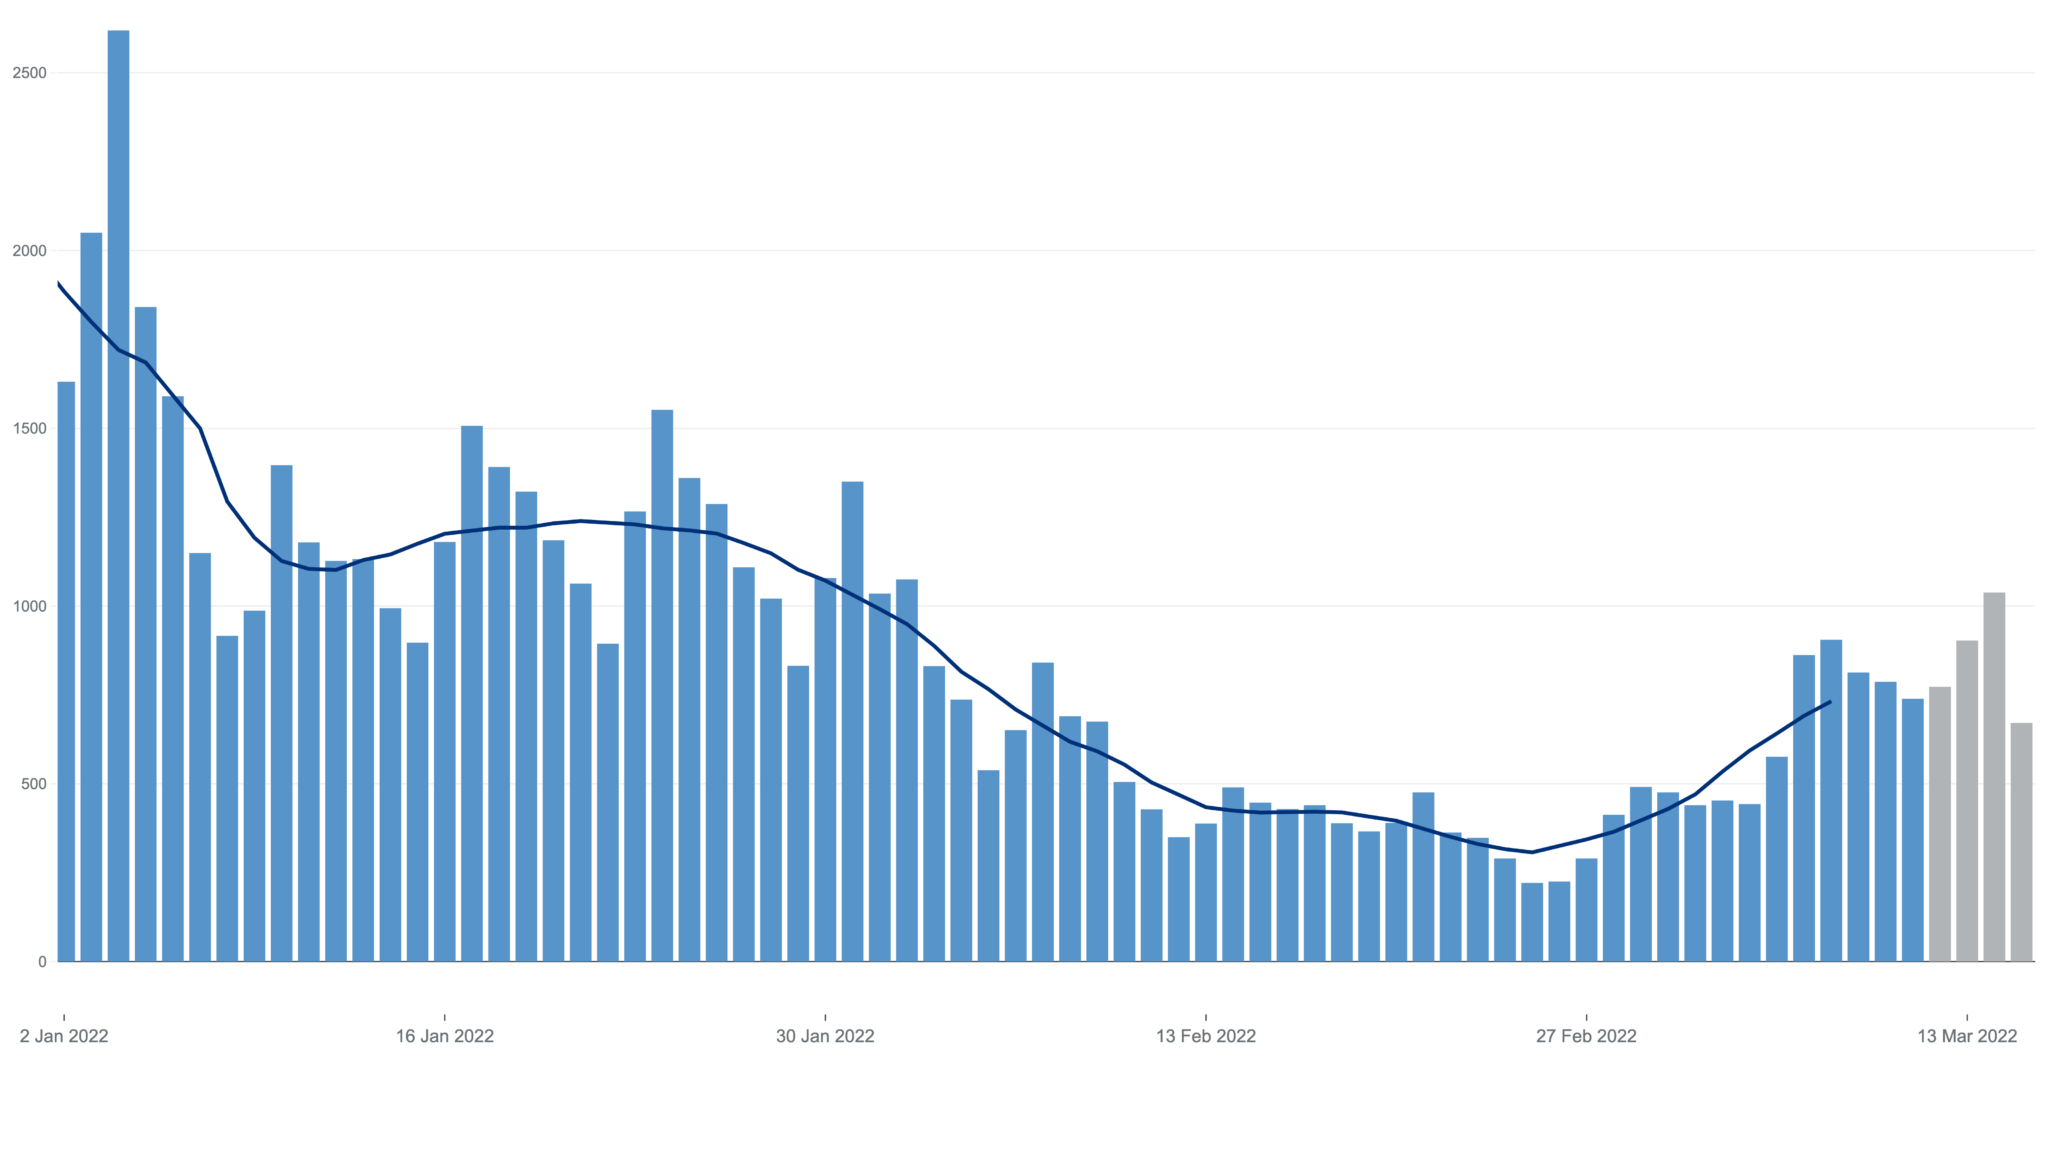
A chart showing cases in Lincolnshire. | Image: Gov.uk
Cases in Lincolnshire have been on a slight uptick over the past few weeks according to the government’s COVID dashboard. After a daily low of 221 new cases on February 25 there has been a steady climb with the highest complete data for March 8 showing a daily case number of 905. Incomplete data for March 14 shows 1,038 cases confirmed.
The figures broadly reflect a similar pattern across the UK.
In Councillor Wootten’s ward of South Kesteven, the pattern is almost replicated in terms of highs and lows. The lowest day recently was February 26 with 36 new cases confirmed, while March 8 saw 199 cases – 22% of the county’s figures – confirmed. March 14 shows an incomplete data of 214 cases.
According to the dashboard, North Kesteven is the area with the highest seven day rate per 100,000 population at 812.5. It saw 32 new cases confirmed on February 25 – but by March 8 the figure was up to 189 new cases. Incomplete data from March 14 shows 203 new cases.
East Lindsey has the lowest infection rate of the districts at 561.1. The district’s most recent high was on March 9 with 144 new cases confirmed – the figure is on par with incomplete data from March 13 and is up from a February 26 low of 35.
Testing continues on a downward trend
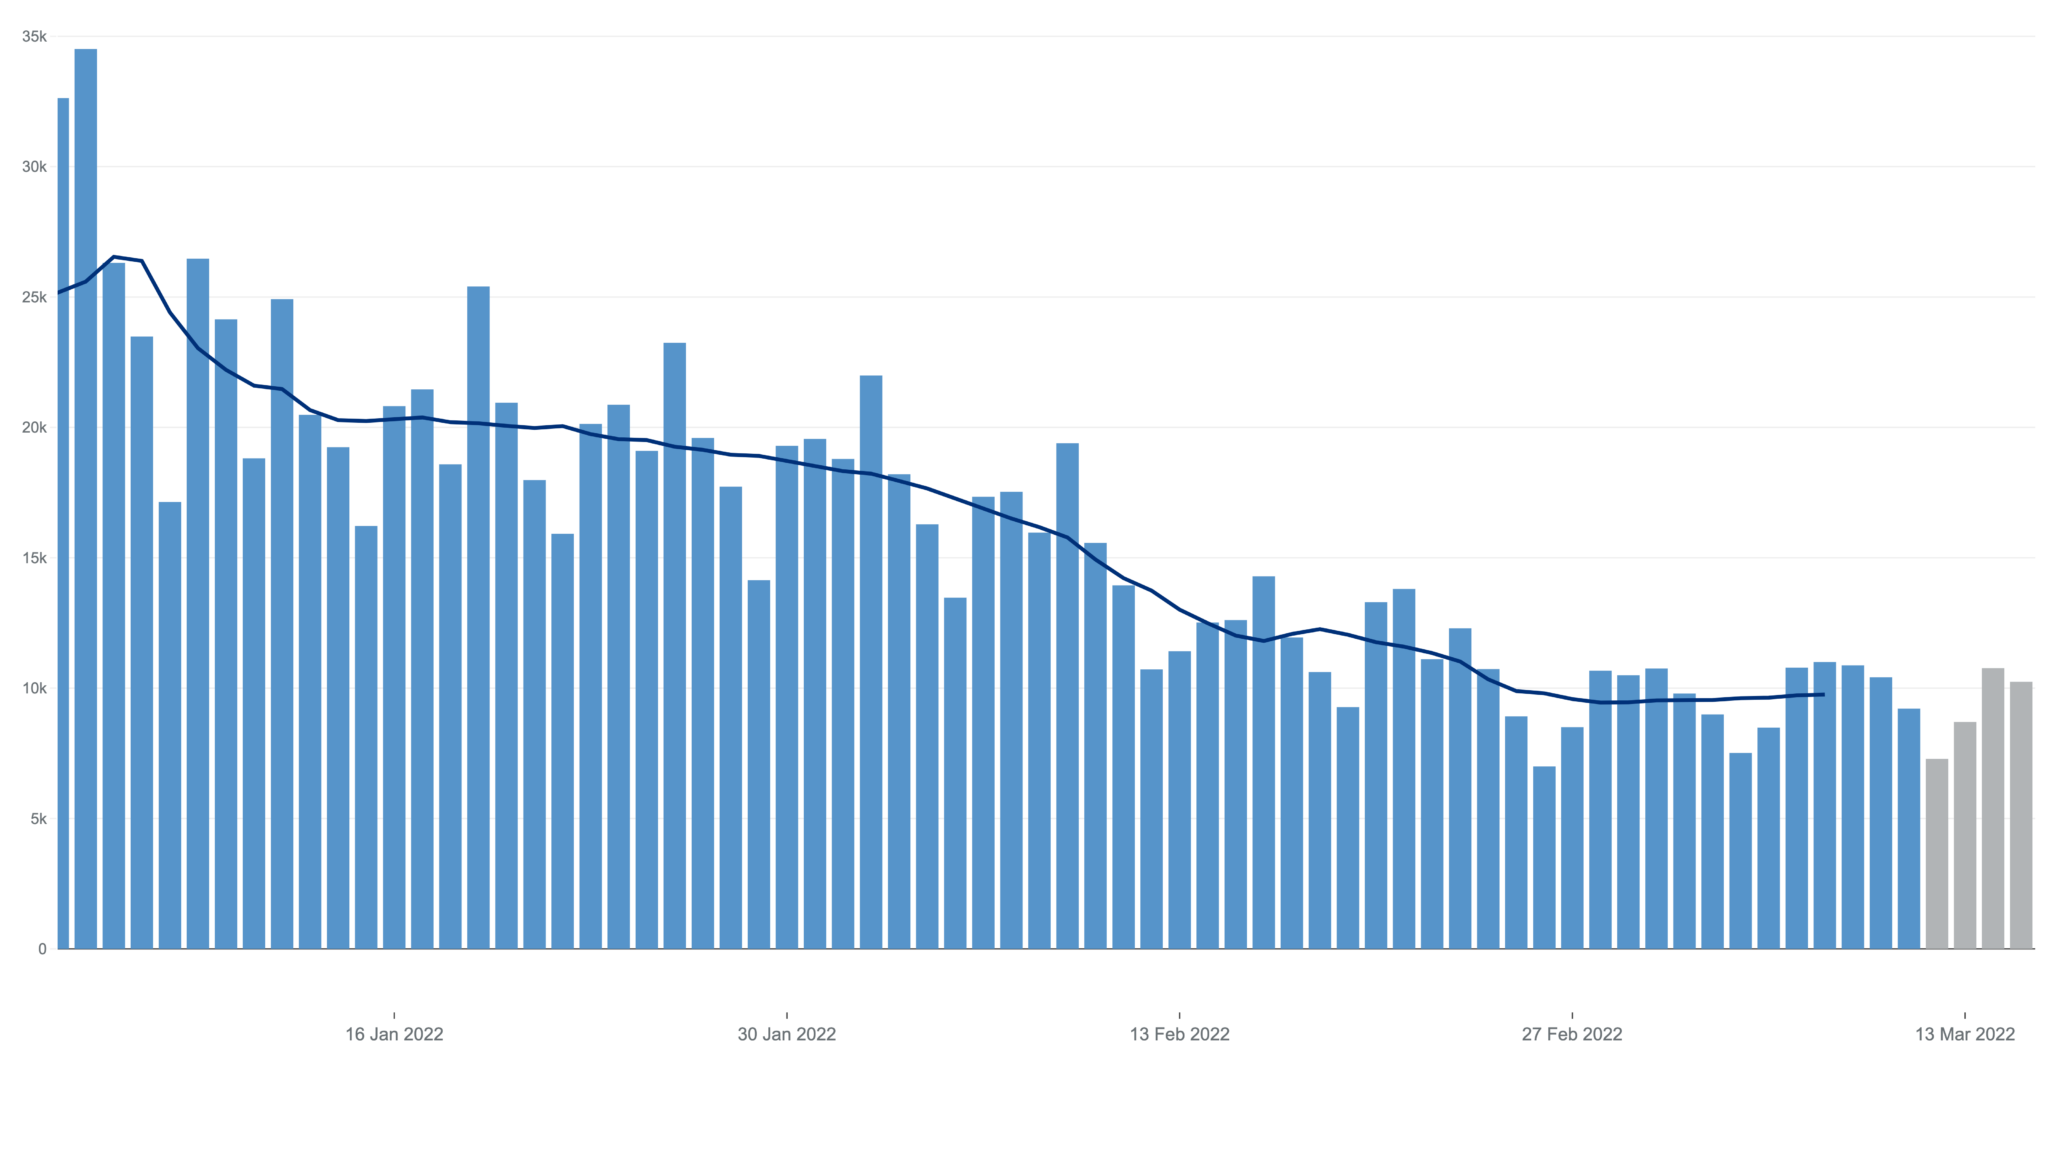
Testing figures in Lincolnshire show a decrease. | Image: Gov.uk
As COVID restrictions ease, and after two years with the virus, it’s probably understandable that so does the vigilance of people.
The government’s plan for Living With Covid includes leaving people to take personal responsibility for their own safety. Free testing for the majority of people will soon come to an end, with shops already selling kits at slightly marked up prices.
The COVID dashboard shows a marked decrease in the number of tests being carried out since the festive period, with a high on January 4 of 2,050,101 tests being reported. Since mid-Febuary the number of tests being reported has mainly levelled out though again shows a slight increase over the most recent two weeks.
In Lincolnshire, testing bottomed out on February 26 with 8,915 tests being reported. It has hung around the 10,000 tests mark for the majority of days since then, though with the most being 10,998 on March 8.
At a district level, our current highest infected area North Kesteven has mostly stuck around the 2,000 tests a day mark. The figures dropped to 1,156 on February 26. the official highest number of tests were carried out on March 9 with 1,980 done – however, incomplete data for March 14 shows a higher figure of 2,007.
Fewer patients in hospital with COVID-19
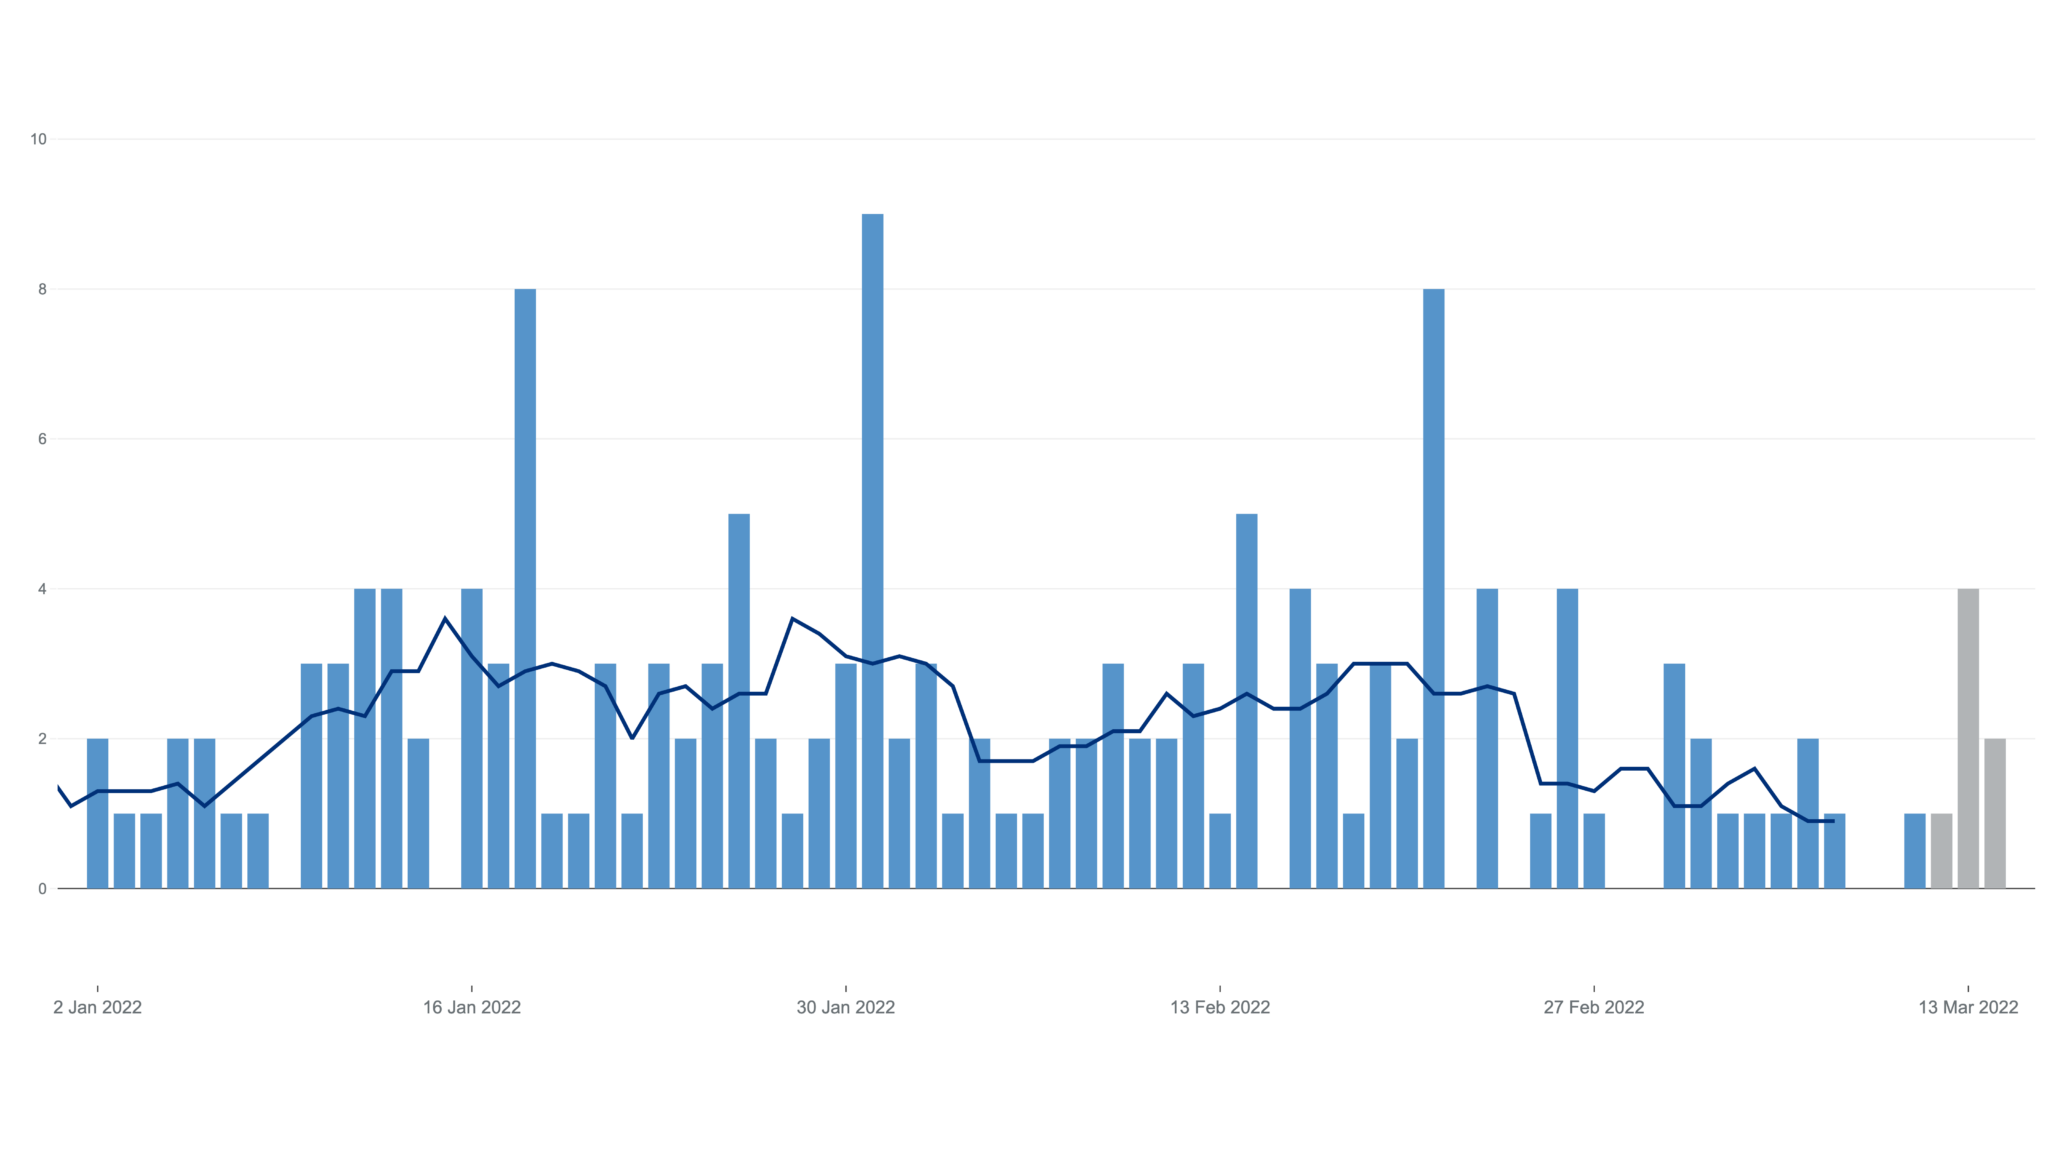
Hospital patients in Lincolnshire. | Image. Gov.uk
With an increase in vaccinations and boosters – we’ll come to those in a bit – the two big indicators now being looked at as a sign of how serious the virus is, are hospitalisations and deaths.
Taking the first of those, the COVID dashboard shows a swing upwards in the number of patients admitted to hospital with a daily figure of 1,753 on March 9, up from 1,004 on February 19.
Despite this, however, the number of patients in mechanical ventilation beds in the UK has been on a slow downward trend levelled out slightly at the beginning of March, with most days between the 250-260 mark. The last two reported days of March 14 and 15 though, have increased to 280 and 281.
Data from Lincolnshire’s main hospital provider United Lincolnshire Hospitals Trust shows a most recent seven-day admission average of 5.9 COVID-19 patients. In recent weeks it saw just one admission on February 12, but March 9 saw nine admissions.
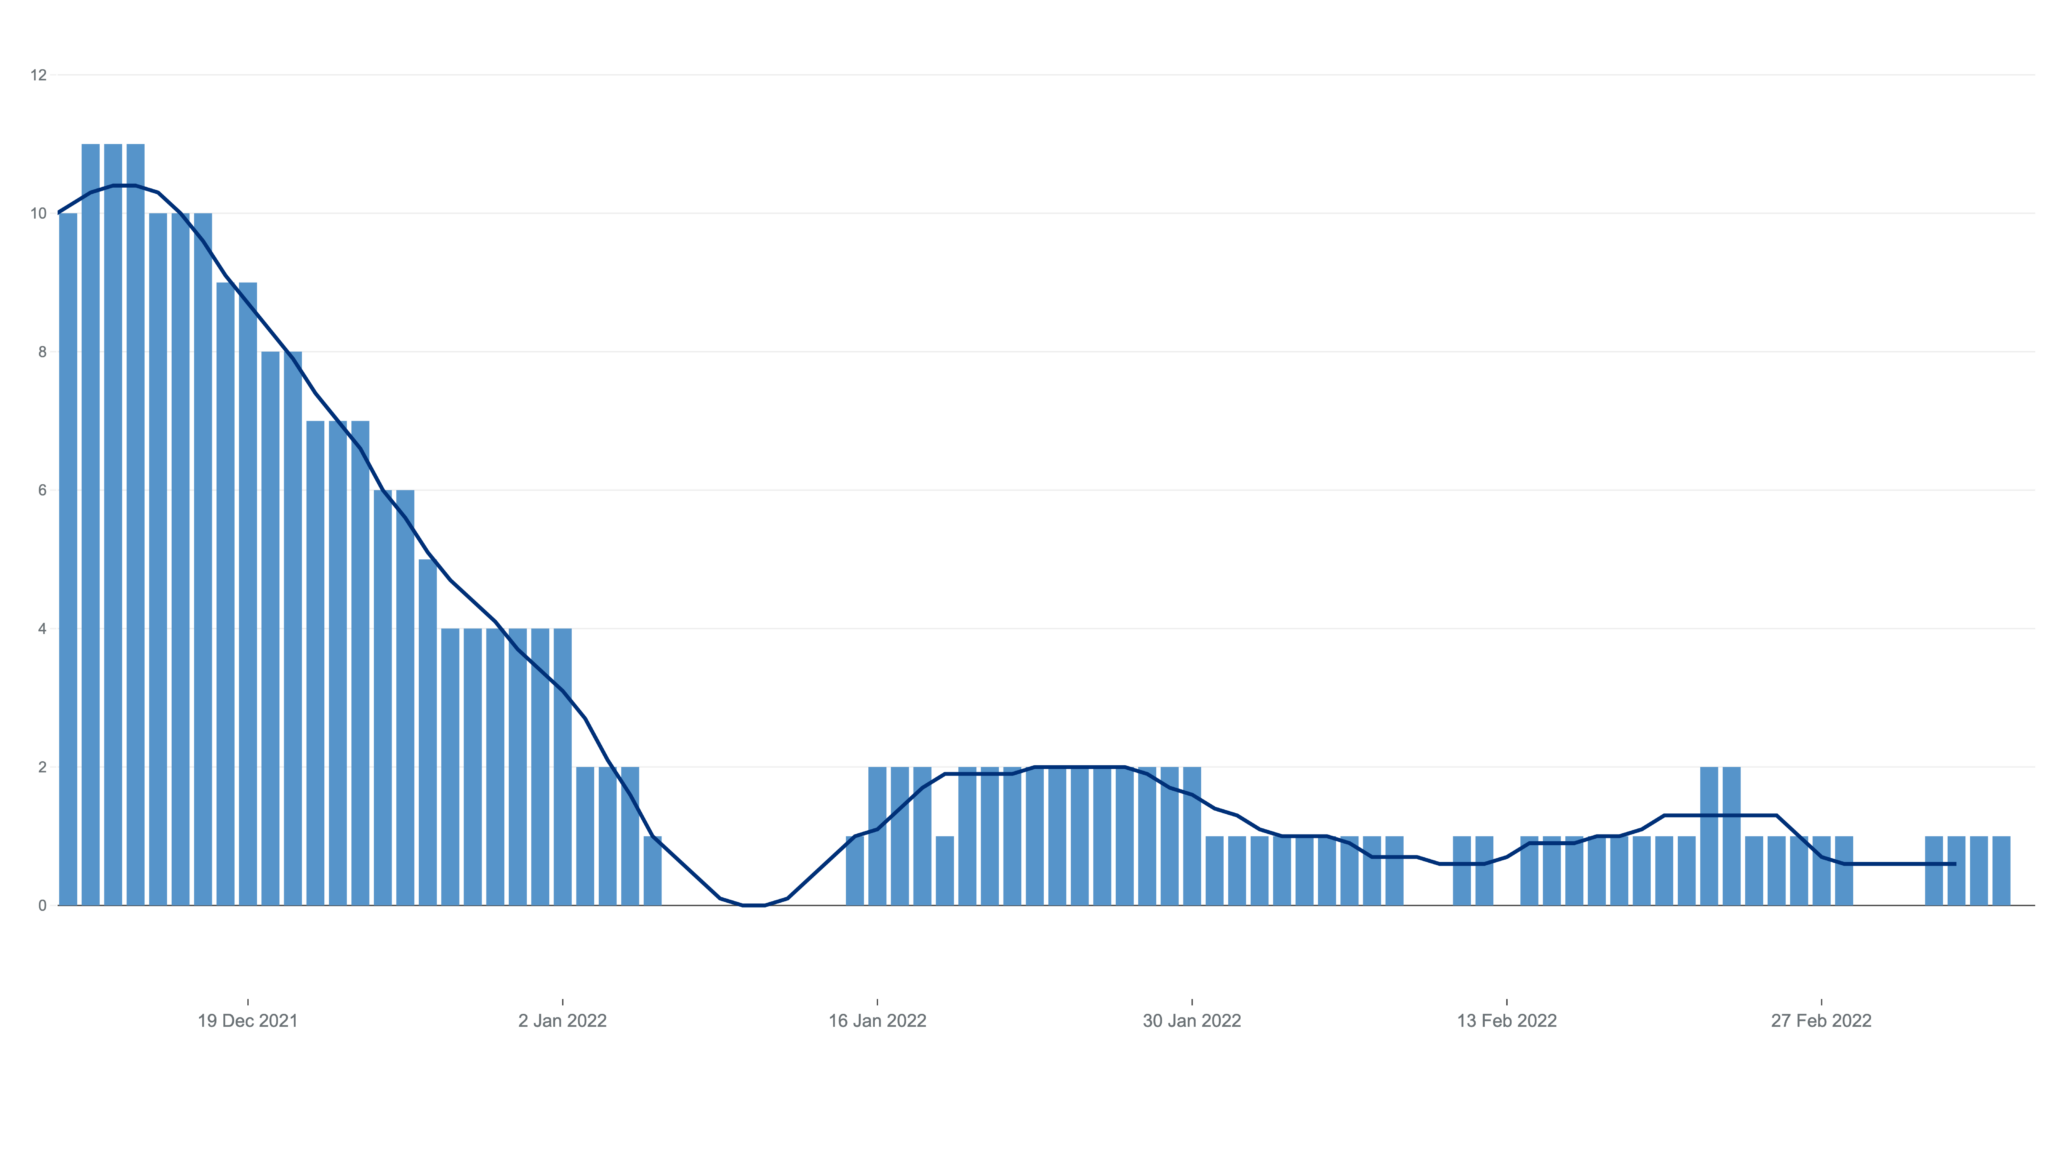
The number of people on ventilator beds has dropped significantly. | Image: Gov.uk
The data showed there were 35 people in hospital with COVID on March 8, with figures showing a slight uptick but not reaching the heights of January, or even the middle of February where there were 57 patients on February 13.
In terms of the most life threatening cases, the number of patients on ventilator beds saw a sharp drop from mid December – with most days since January showing one or two patients a day registered. Though in very positive news there have been several days where there have been 0 patients in the most precarious position.
Several days without deaths in the county recently
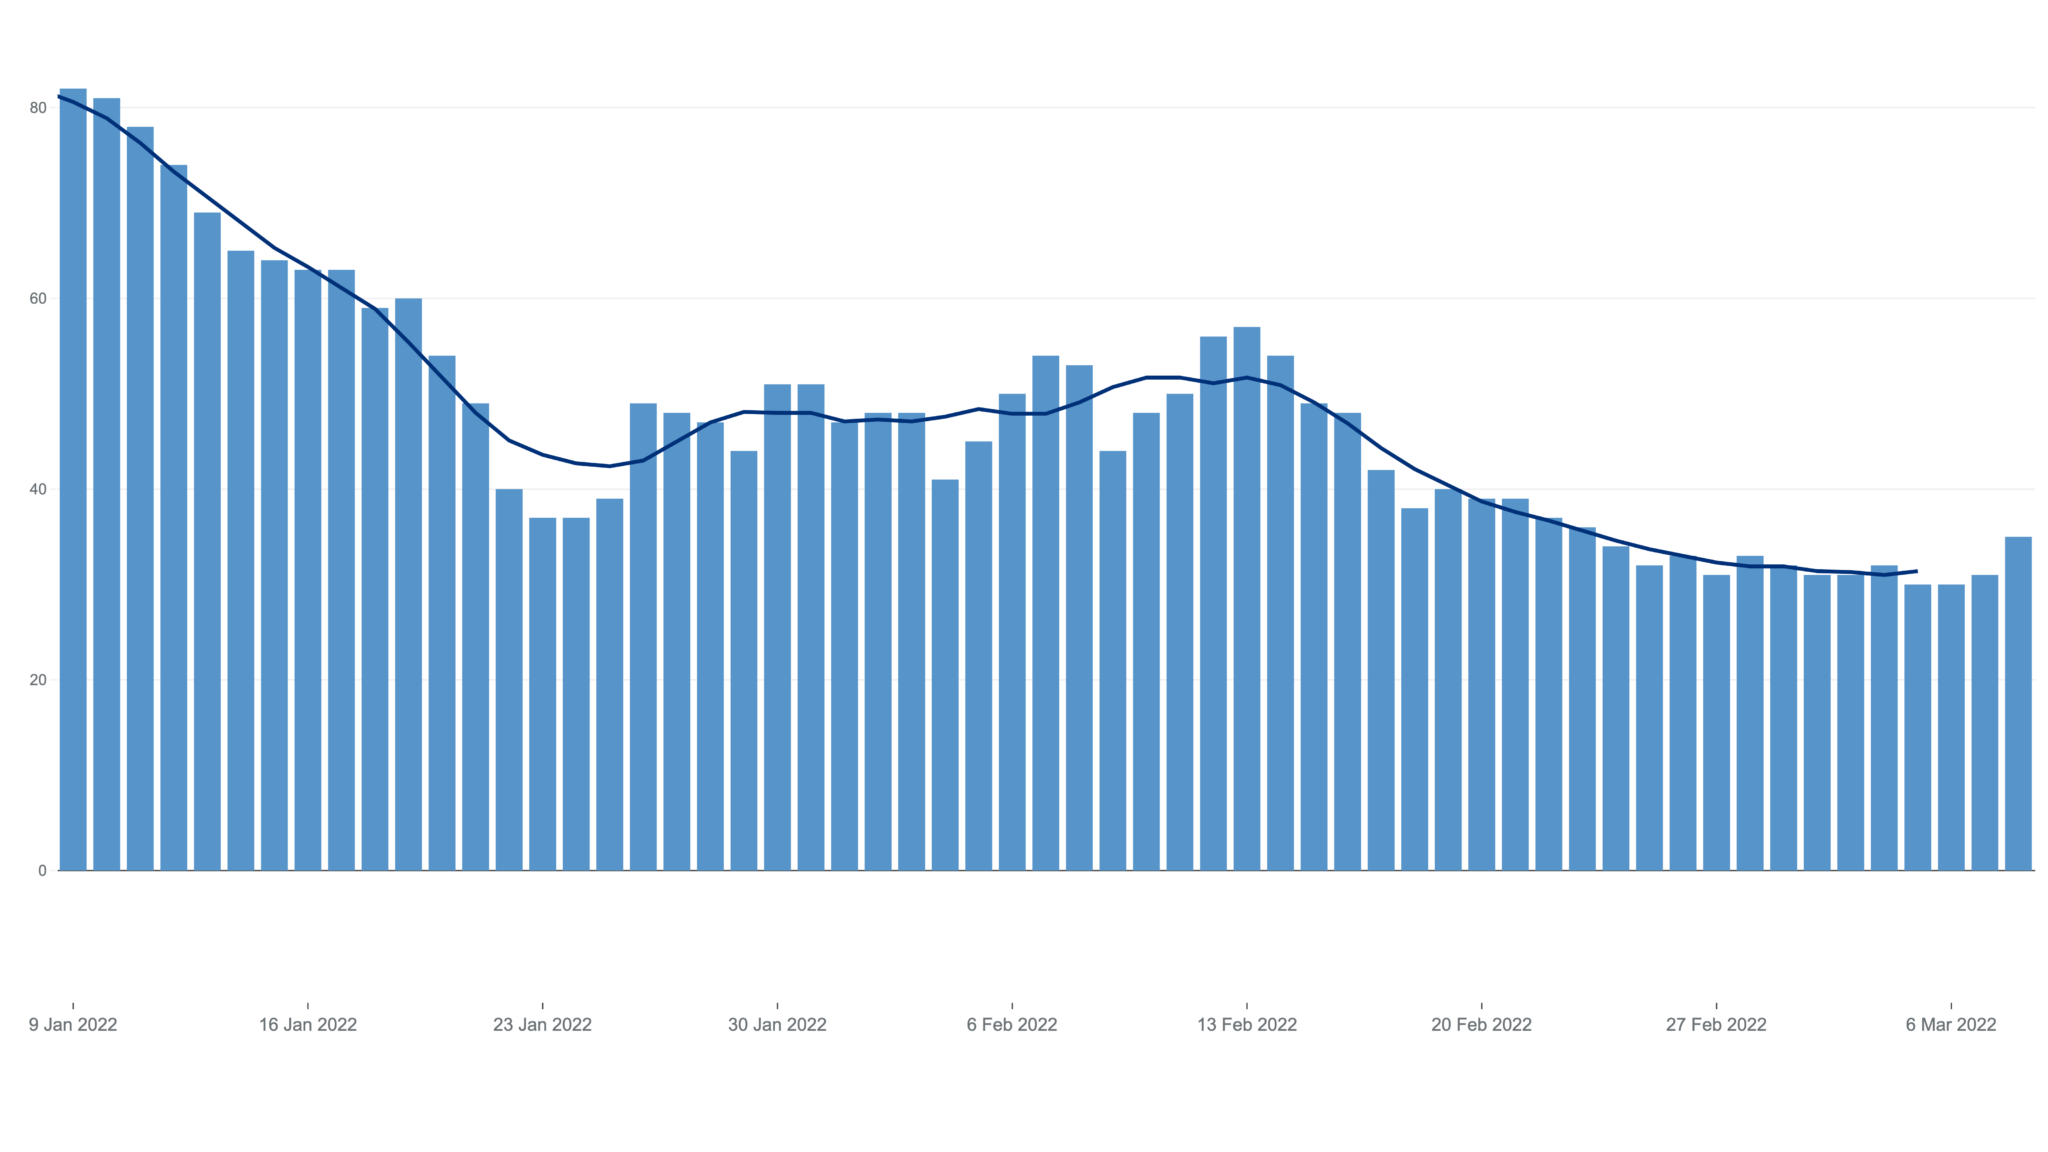
A chart showing deaths in the county, including several days without a tragedy. | Image. Gov.uk
The number of deaths associated with COVID has significantly dropped especially when compared to the heights of the first two waves, where April 2020 reached 1,076 deaths at its peak and January 2021 reached 1,299 daily deaths, before the peak in January 2022 reached 307.
Since then the numbers haven’t exactly bottomed out, but they have been on a continuous downward trend nationally, with the most recent UK figures confirming 82 deaths on March 11.
In Lincolnshire, the highest day recently was nine deaths on January 31, and then eight on February 21. There have been seven days since February 14 that have seen 0 deaths, with most recording one or two, but some reaching four.
The last confirmed reported death in the currently highest infected district of North Kesteven, was on February 25 – though incomplete data suggests another has been reported on March 13.
Though a tragedy when anyone dies, when combined with the hospitalisation figures above, the data backs up the suggestion vaccination is working to keep the majority of cases to mild symptoms or less.
Vaccinations continue to rise – despite slowing in uptake
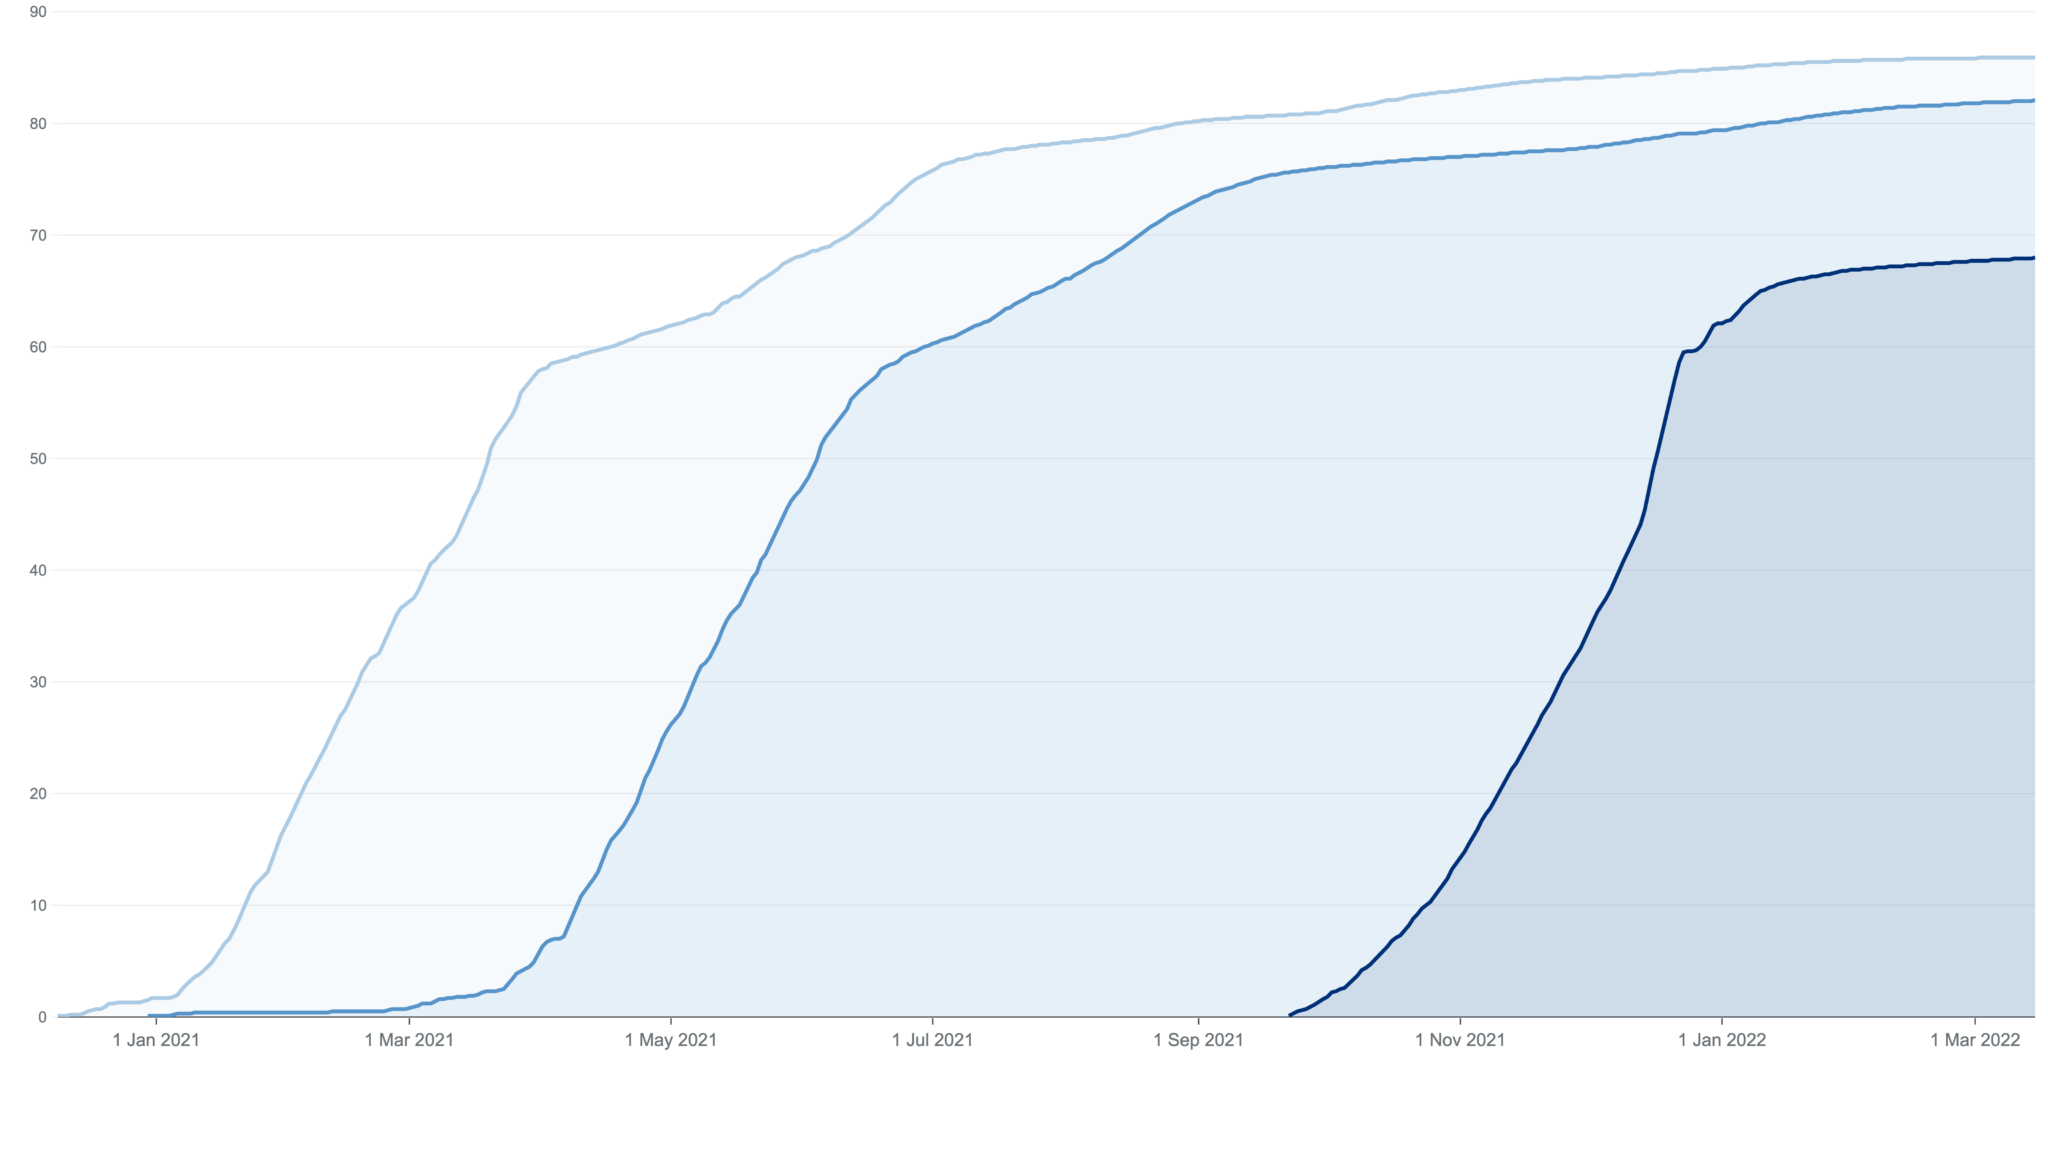
A graph showing the uptake of all three doses across Lincolnshire. | Image: Gov.uk
Finally we reach vaccinations, the government has claimed its programme has been a massive success and it’s clear to see why looking at the data.
Almost 92% of eligible adults have now had their first dose, followed by 85.6% having their second. Those taking up the booster jab is currently around the 67% mark, however, charts show the figure continues to rise – albeit at a slower rate than the first two. In total around 140.5 million doses have been given out.
This is to be expected given many younger generations believe that with two doses their body is strong enough and that the rapid succession of second and booster doses over the past few years has been too much. Some have also fallen by the wayside as their beliefs change about the seriousness of the pandemic.
Lincolnshire is slightly behind the national figures, showing that 85.9% of residents have had their first dose and 82.1% their second. However, when it comes to boosters we’re slightly ahead of the game at 68%.
The highest percentage of vaccinated people is in the 85-89 year olds with 97.9% of eligible adults taking up the jab. The 12-15 age group – the latest group to be offered it – currently sits around the 65.8% uptake mark.
In total 1,677,260 doses have been given, of which 483,219 are booster jabs and 583,336 are second doses.
So Lincolnshire has been doing its part, and continues to do so. What happens next, as the government has clearly laid out, is up to its residents.
The Lincolnite welcomes your views. All comments are reactively-moderated and must obey the house rules. Please stay on topic and be respectful of other readers.
Exciting news for MyLocal app users and The Lincolnite readers! Our latest update is now available to download from your app store and comes packed with the best local news experience you can enjoy.
Revamped News Feed: Enjoy faster loading times and smoother scrolling that make catching up on local news a breeze.
New Play Video Feed: Dive into a dynamic video feed that brings local stories to life in a whole new way.
Enhanced In-App Browser: Access external links quickly and efficiently, right from the app, without any distractions.
Update your MyLocal app from your app store (version 2.73) now and start enjoying these great new features today!
P.S.: Start your MyLocal membership today to support MyLocal and The Lincolnite deliver you a better local news experience and honest journalism from across Lincolnshire.
P.P.S.: We have some huge things in the pipeline, stay tuned!
 Whatsapp